Coralogix Metrics vs Popular Open Source Engines.
This benchmark examines the impact of high concurrency, high cardinality querying on latencies for major metric backends, including Coralogix. Coralogix is a full-stack observability platform. It processes telemetry as it streams in and keeps it, always queryable, in the customer's own cloud object storage.
Testing metrics backends in high concurrency, high cardinality, high compute environments
We examined Coralogix and the open-source Prometheus, Grafana Mimir and ClickHouse (the last in both its MergeTree and native TimeSeries engines), and their ability to handle high cardinality analysis across a range of complex queries, at concurrencies from 10 to 100 queries at once, and tracked latency and error rates.
Method
No special flags
Local TSDB on SSD
MergeTree on SSD
TimeSeries on SSD
Memberlist ring + S3
One generator wrote the same data to every platform: 1,800,000 active series at 60-second resolution.
Retention
Each platform held one week of history at 60-second resolution before the first query ran: 10,080 samples for every one of the 1,800,000 series, about 18.1 billion samples in all. Prometheus kept them in local TSDB blocks, Grafana Mimir in blocks on S3, ClickHouse in MergeTree tables, and Coralogix in its own format on S3 too, in the test account's object storage, where it also keeps five-minute and one-hour rollups. Every query here was answered from that same one-week corpus.
A fifth engine, ClickHouse's native TimeSeries engine, holds the same one-week corpus and was measured the same way. Unlike its general-purpose MergeTree sibling it stayed up across the whole concurrency range, but it is the slowest of the platforms that finished.
Configuration
Every platform ran stock, out-of-the-box configuration. The one accommodation was ingest: Mimir's per-tenant series limit was raised from its default of 150,000, because at the default it rejects 92% of the series before any query can run. No query timeout, cache, concurrency limit or sharding setting was changed on any platform, Coralogix included.
ClickHouse was tested in two forms, its general-purpose MergeTree engine and its native TimeSeries engine, each on its own node, and for each the number of collectors was scaled up to accelerate the one-week backfill needed for parity with the other platforms. Those collectors were scaled back to their defaults, and the instance was verified idle of other activity, before the query benchmark ran.
Differences
ClickHouse (MergeTree) does not run PromQL. The other platforms ran the same query strings; MergeTree ran hand-written SQL translations. ClickHouse's native TimeSeries engine speaks PromQL directly and ran the same strings as the rest.
Network. The three open-source platforms ran in the same private network as the query client. Coralogix was queried over the public internet, which at its fastest added 10.7 ms to the round trip. Engine times use this minimum as the assumed network latency and subtract it. Queries that return more data take slightly longer to cross the network, so the minimum is the least generous figure for Coralogix.
Run it yourself Est. cloud spend ≈ $600
Copy the prompt below into your own coding agent or runbook to stand the whole thing up and reproduce every number.
Reproduce this benchmark end to end. The target is five metrics backends holding an identical one-week corpus at matched infrastructure spend, then the same query ladder swept over cardinality and concurrency. Run everything on stock, out-of-the-box configuration.

== Platforms and infrastructure ==
Stand up five backends at matched spend (roughly $1,140 to $1,235 per month each). Use one region. Put the query client in the same private subnet as the four self-hosted nodes.

- Coralogix (SaaS): a standard account, no special flags. Billed on ingest, about $1,178/month for this volume.
- Prometheus: 1 node, 32 vCPU / 128 GiB (for example AWS m7i.8xlarge), local TSDB on a gp3 SSD sized for a week of blocks.
- ClickHouse (MergeTree): 1 node, 32 vCPU / 128 GiB, plus an ingest collector. MergeTree tables on gp3 SSD.
- ClickHouse (TimeSeries): 1 node, 32 vCPU / 128 GiB, plus an ingest collector. Native TimeSeries engine on gp3 SSD.
- Grafana Mimir: 9 nodes totalling 36 vCPU / 144 GiB (for example 9x m7i.xlarge), replication factor 3, memberlist ring, blocks on S3.

== The corpus ==
One deterministic generator with a fixed random seed produces a single dataset and writes the same rows to every platform, so all five hold identical data. 1,800,000 active series at 60-second resolution, one week of history: 10,080 points per series, about 18.1 billion samples. Split the series across four cardinality bands by label: 100k, 200k, 500k and 1,000,000 active series. Use a realistic label set (cluster, namespace, service, pod, region, http_route, http_method, status_code, customer_id).

== One-week backfill ==
Backfilling a week is the slow, expensive part. Do it on fat transient capacity (extra collectors, bigger boxes) so it finishes in hours, then scale back to the steady-state footprint above and confirm the query node is idle before measuring. That transient compute is most of the ~$600 run cost. Use each platform's fastest native bulk path, not a live remote-write replay of the week:

- Prometheus: render the week as OpenMetrics and import it straight into TSDB blocks with `promtool tsdb create-blocks-from openmetrics DUMP.om DATA_DIR`, then point Prometheus at DATA_DIR. Do not replay over remote-write.
- ClickHouse (MergeTree): straight batched INSERTs into the MergeTree table (metric, label set, timestamp, value) over the native protocol. Parallelise across several collector processes to hit the rate, then scale back to one before measuring.
- ClickHouse (TimeSeries): the same straight-INSERT path into the TimeSeries engine's backing tables, batched and parallelised, then scaled back. The engine answers PromQL over it afterwards.
- Grafana Mimir: build TSDB blocks the same way as Prometheus, then upload them into Mimir's object store with mimirtool block upload (backfill). First raise the per-tenant active-series limit above its 150,000 default, or Mimir rejects about 92% of the series before any query runs.
- Coralogix: send the week over Prometheus remote-write (or OTLP) to the account's metrics endpoint with the historical timestamps, parallelised across writers. It lands in the account's own object storage, with 5-minute and 1-hour rollups kept automatically.

== Query ladder ==
Ten PromQL queries, lightest to heaviest:
  1. a fully pinned single-series read
  2. label-values enumeration
  3. an equality label filter
  4. a regex label filter
  5. sum by (service) on a gauge
  6. sum by (service) (rate(...[5m]))
  7. topk(10, ...)
  8. histogram_quantile(0.99, ...) p99
  9. a group_left join onto an info metric
  10. a multi-window multi-burn-rate SLO alert

Prometheus, Mimir and ClickHouse TimeSeries run the identical PromQL strings. ClickHouse MergeTree does not speak PromQL, so it runs hand-written SQL translations of the same ten. Pin every query to one fixed instant inside the one-week window, the same instant for all platforms, so every run hits the same data.

== Sweep and measurement ==
Run the full ladder against every platform, at each cardinality band (100k, 200k, 500k, 1M), under concurrency 10, 20, 30, 40, 50, 60, 70, 80, 90 and 100 queries at once. That is 5 platforms x 10 queries x 4 bands x 10 concurrency levels, 2,000 cells.

For each (platform, query, band, concurrency) cell:
  - Drive it closed-loop: hold exactly that many workers busy, each firing the query, waiting for the response, then firing again, with no think time.
  - Measure for a fixed 20-second window per cell and record every completed request.
  - Report p50, p95 and p99 latency over those requests, plus the sample count and error rate.
  - Cap any single query at a 10-minute timeout. A cell where every request errors or times out is recorded as stopped answering, not as a latency.

== Parity rules ==
  - Stock configuration everywhere. The only change is raising Mimir's per-tenant series limit. No query timeout, cache, concurrency limit or sharding setting is touched on any platform, Coralogix included.
  - The four self-hosted platforms share the query client's private network. Coralogix is queried over the public internet, which at its fastest adds 10.7 ms to the round trip; subtract that fixed minimum from Coralogix times to get engine time.
  - Scale any backfill collectors back to default and confirm the box is otherwise idle before the first measured query.
Results
Engine time subtracts the minimum 10.74 ms round trip over the public internet from Coralogix's times, since the other three platforms ran on the query client's private network.
At the beginning of the bench, Prometheus demonstrated why it is one of the dominant metric solutions in the market, with excellent latency and very little variation between low concurrency, high concurrency, low cardinality and high cardinality. However, as the experiment progressed, it became clear that the combination of high compute, high concurrency and high cardinality was having a significant impact on response times. At higher concurrency, Mimir and ClickHouse with the MergeTree engine struggled, and either began producing errors or exceeding the 10-minute query timeouts.
The latency and error landscape
Coralogix didn't see a single error during the benchmark, and Prometheus performed admirably. ClickHouse's TimeSeries engine also outperformed its MergeTree counterpart, with errors only beginning at high concurrency (>50) and high cardinality (500k+). Grafana Mimir produced errors from early on, and collapsed past concurrency 30.
One grid per platform: active series down the side, queries-at-once across the top, at 10, 30, 50 and 100. Switch between error rate and median latency.
The impact of concurrency
Concurrency had little effect on Coralogix: from 10 to 100 queries at once, its median for rate by service rose from 0.5 s to 0.9 s. Prometheus climbed from 1.2 s to 6.4 s and ClickHouse (TimeSeries) from 0.8 s to 6.3 s. Grafana Mimir and ClickHouse (MergeTree) dropped out entirely before the top of the range, Mimir at 30 and MergeTree at 40; the red dotted lines mark where each stopped answering.
Rate by service at 1M series. Each line is one platform's median latency; red dotted lines mark where a platform stopped answering.
The impact of cardinality
Latency grew with series count. At 30 queries at once, four engines were still answering; Grafana Mimir had already collapsed. Coralogix was fastest at every size, 0.6 s at 1M series, while Prometheus and ClickHouse (TimeSeries) ran to 1.8 s and ClickHouse (MergeTree) to 33 s.
Rate by service at 30 queries at once. Each line is one platform's median latency.
Appendix: All results
Median latency of successful queries. Green is the fastest platform with no errors; red cells had errors.
Appendix: All queries
The ten PromQL queries, run against every platform at each cardinality and concurrency. Sampled label values (shown as “…”) were pulled from the data and rotated across repeats so no two runs hit the same warm cache entry. The metric name carries the active-series band as a suffix (for example http_requests_total_b4 at 1M series).
Business cardinality
The Coralogix Metrics Engine is designed for cardinality in the millions. A label can be a user, a tenant, a plan or a region, so metrics stop being only operational signals and start tracking the business: checkouts per customer, errors per tenant, revenue per region.
A metrics engine built for parallel queries
The Coralogix Metrics Engine is fully Prometheus-compatible, and custom built in Rust to run highly parallelised, distributed queries. High-cardinality scans fan out across shards and are aggregated where the data sits. Wide time ranges are split into windows that run at the same time.
Prometheus compatible, Coralogix optimised
Prometheus remote write and OpenTelemetry send metrics in as they do today. Dashboards, alerts and recording rules keep running on the same PromQL, and Olly, the Coralogix AI agent, investigates with the same metrics.
Your metrics, in your own cloud account
Coralogix writes your metrics to a bucket in your own cloud account: Amazon S3, Google Cloud Storage or IBM Cloud Object Storage. They are kept in an open format, so other tools can read them without going through Coralogix, at raw, five-minute and one-hour resolutions, each with its own retention.
See the architecture for yourself
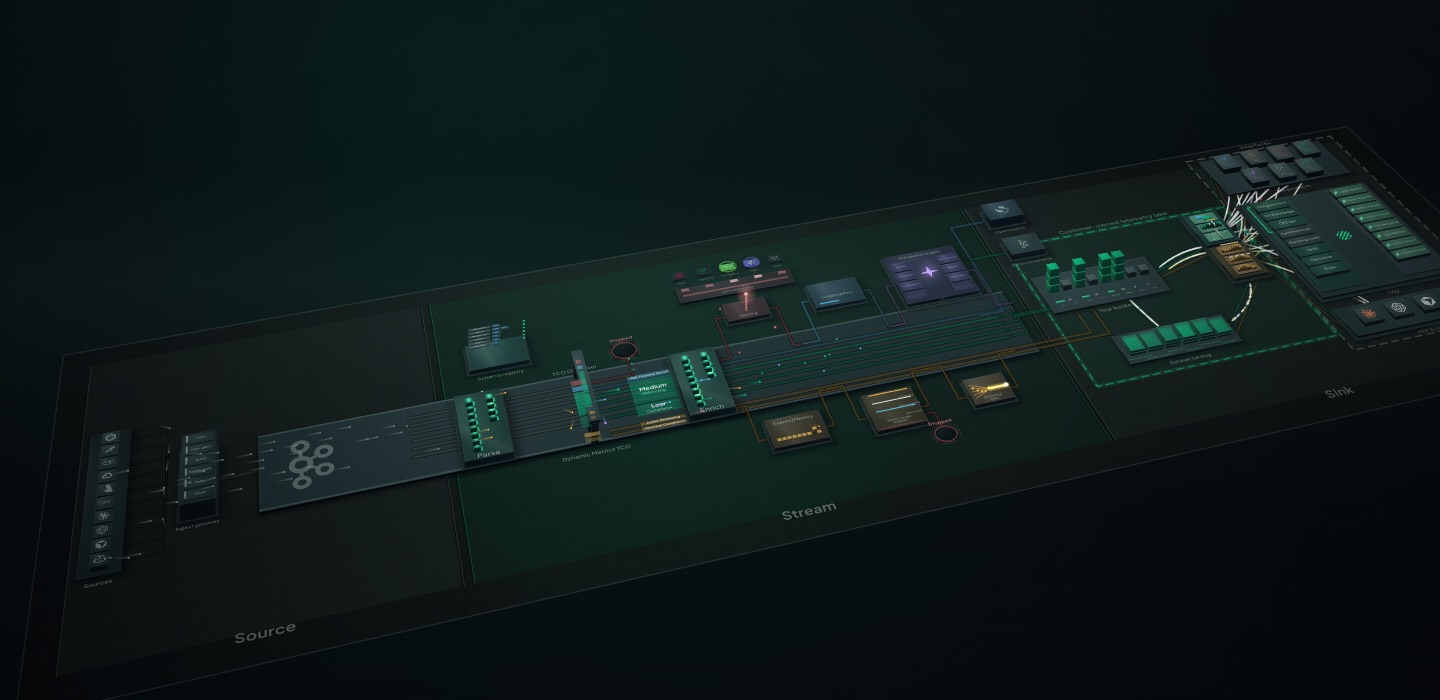
The Coralogix Metrics Engine is one part of Streama, the architecture behind the whole Coralogix platform. Walk through the model, from the moment telemetry arrives to the engines that answer your queries.
 Take the Streama Tour