Engineering Benchmarks.
Coralogix is a full-stack observability platform. It processes telemetry as it streams in and keeps it, always queryable, in the customer's own cloud object storage. This page dives into our engineering teams. For the first time, we publish our live DORA metrics, updating daily, coupled with feature releases, production lead time, bug fixes, features shipped and more, including our log of successful AI optimizations that we've used to control cost and ensure excellent ROI from our AI coding strategies.
DORA - past 30 days
Feature releases went from about 4 a month to 130.
Coralogix shipped about 4 feature releases a month from May 2022 to August 2025. Since AI-assisted delivery began in September 2025, that rose to 130 in October 2026, 33 times the old rate.
Every measure was better in October than in January.
The line traces agent share month by month. Each outcome row runs from grey, its weakest month, to green, its strongest, with its best month in gold. January to October 2026.
Output rose with agent adoption.
Each dot is a month from January to October 2026, placed by the share of pull requests made with coding agents.
Incidents fell to a ten-month low.
Statuspage incidents fell to three in October, the fewest of any month since January. Median recovery time across those ten months was 38 minutes.
Coding agents now make half of our pull requests.
The share of developer pull requests made with coding agents rose from 6% in January to 49% in October, and to 54% of pull requests opened in the first nine days of November.
Pull requests rose 2.5x, and agent-made pull requests 19x.
Monthly developer pull requests grew from 4,116 in January to 10,149 in October. Pull requests made with coding agents grew from 260 to 4,965.
33x the features. Same lead time
The median time from merge to the first production pod stayed between 23 and 44 minutes in every month since December 2025, while production releases per day more than doubled.
600 services across 17 production clusters.
Distinct services running in production grew from 499 in December 2025 to 599 in April, and have stayed close to 600 since, across up to 17 production clusters.
What we learned from using coding agents in 2026.
Hundreds of people at Coralogix use Claude Code, Cursor, Codex and Copilot every day, and their telemetry lands in Coralogix. These are our findings from 2026, and the changes we made because of them.
Learnings log
| When | Problem | Signal | Solution | Savings |
|---|---|---|---|---|
| Nov 2026Governance | 18% of our spend came from agents no one was watching | Cloud agents, headless CI runs and service accounts had no owner. One nightly job retried a failing migration 40 times a night. | Every service account has an owning team, a budget alert and a cap on retries. Automation spend is reviewed weekly. | −50%18% to 9%share of spend from unattended automation, still being measured |
| Oct 2026Model routing | A third of our Opus sessions were trivial tasks | Maintenance work rose from 22% to 34% of sessions, and 31% of Opus sessions were classified Trivial or Low. | Haiku 5.5 is the default for maintenance subagents. Plan mode runs on Opus and execution on Sonnet. | −55%$0.92 to $0.41per maintenance session, merge rate unchanged |
| Sep 2026Skills | One internal skill cost 14x more per call than the others | pr-description averaged $4.10 per call against a $0.30 median, because it loaded the full repo diff history every time. | The skill reads only the branch diff and the linked ticket. The style guide moved to a cached reference file. | −87%$4.10 to $0.55per call, across 2,300 calls a month |
| Aug 2026Model defaults | Teams outside R&D didn't need Opus | 81% of spend outside R&D ran on Opus because it was the default, mostly for documents, spreadsheets and queries. | The default for groups outside R&D switched to Sonnet 5.5. Opus stayed one click away. | −58%$262 to $109per user outside R&D, with active users and sessions flat |
| Aug 2026Developer experience | Our most expensive features were the ones the agent couldn't test | Ingestion pipeline stories cost 3.2x the median, and 24% of their merged lines were rewritten within 30 days. | The agent got a one-command ephemeral test environment, a skill that wraps it and seeded fixtures, so it tests end to end before opening a PR. | −40%$186 to $112per story delivered, rewrite rate 24% to 9% |
| Jul 2026Delivery | Agent-written code sat waiting for review | AI-assisted PRs opened within hours, but the first review took 1.9 days, more than half the time to merge. | Every PR gets an automated first-pass review for correctness, tests and conventions. Humans review design and risk. | −71%3.1 days to 0.9 daysmedian time from PR to merge, merge rate 78% to 84% |
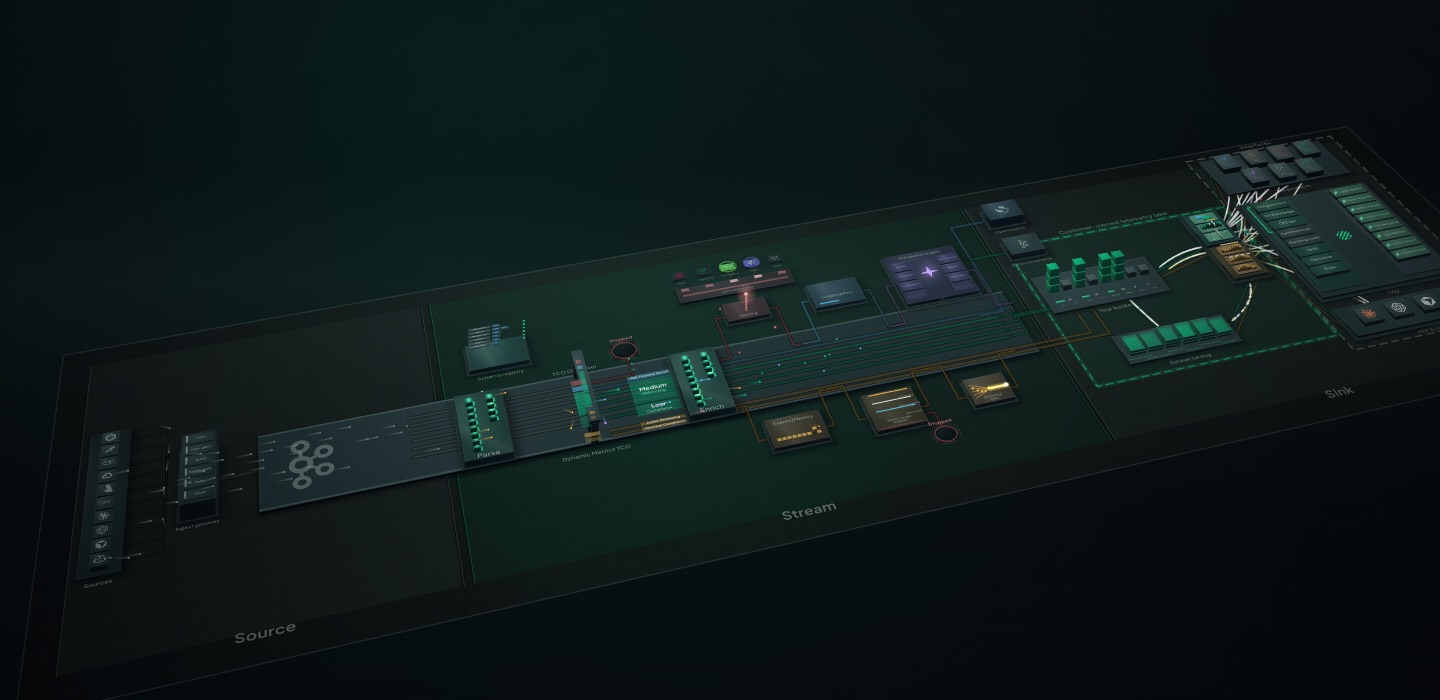
Take the Streama tour
Learn about an architecture that handles billions of daily queries and hundreds of petabytes of data, supporting hundreds of industry leading products and driving unprecedented customer savings.
 Take the Streama tour